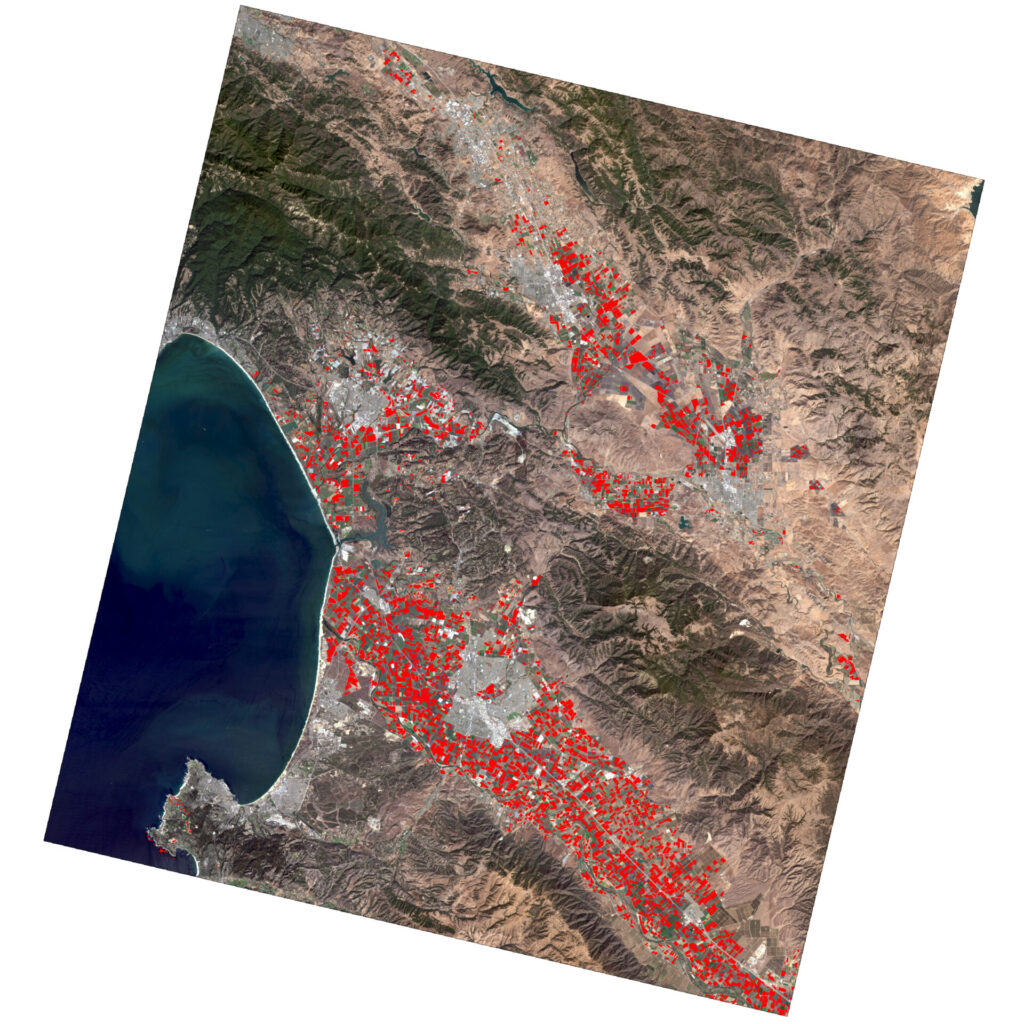
Assessing land-use and land-cover change in Castroville, California using the Normalized Difference Vegetation Index (NDVI) with multispectral Landsat 8 images taken in 2013 and 2015.
The satellite images were processed to reduce the amount of false positive change identified while also minimizing any missed change.
Project highlights
- Processed Landsat imagery dynamically using raster functions.
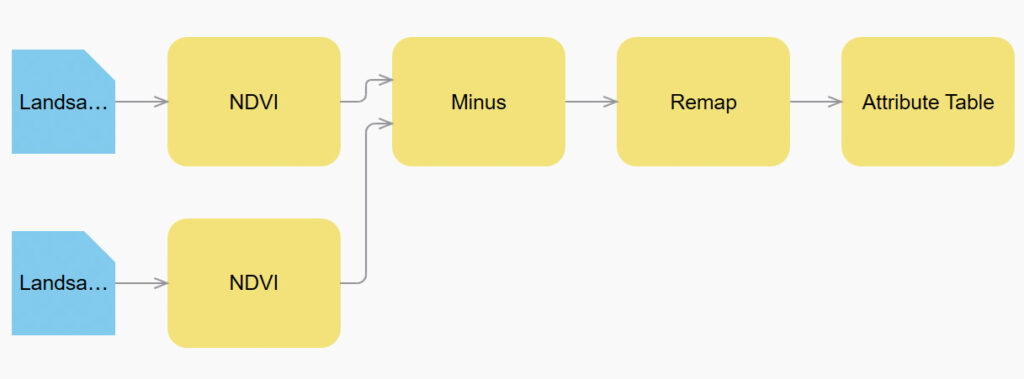
- Performed on-the-fly processing using raster function chains.
- Created NDVI images, used the Difference tool to create a Difference image, highlighted threshold change with the Remap function, and created a change / no change image using the Attribute Table function.
Change / no change image
The final image below was derived from the processed imagery, identifying changes in vegetation in Castroville, California.
Areas in red indicate change between 2013 and 2015.

The images were created from Landsat 8 data acquired from the USGS. The original images were converted to Top of Atmosphere Reflectance using the Apparent Raster Function and clipped to a smaller footprint for ease of use.
Raster function chain

Source: Processing Raster Data Using ArcGIS Pro | Esri Training Web Course