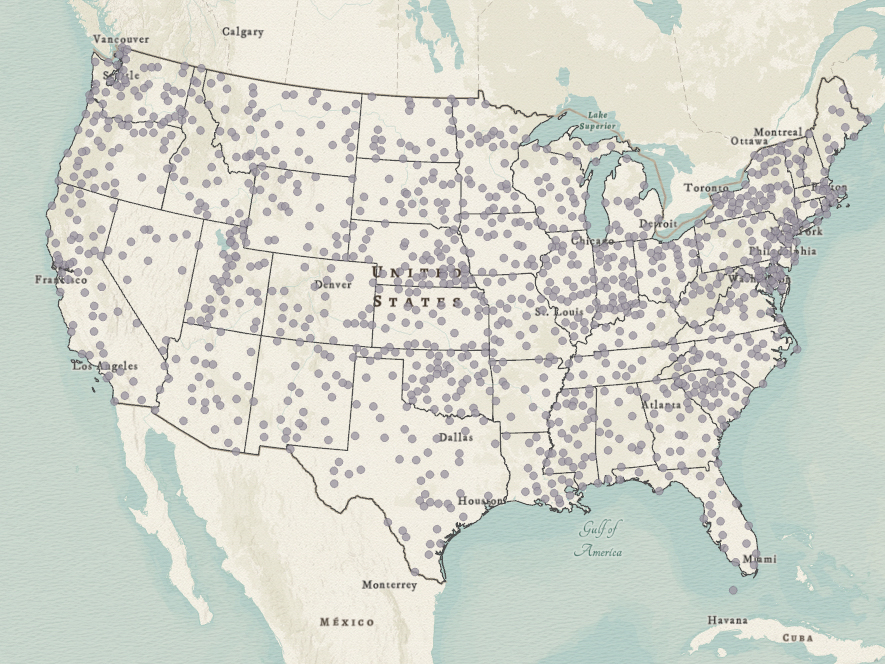
Review and analysis of average temperatures at US weather stations.
Project highlights
- Used queries and statistics to analyze the spatial distribution of temperature values.
- Investigated correlation between average temperatures and latitude of weather stations using a scatter plot.
- Identified outliers in correlation analysis.
Map

Statistical analysis
Distribution of average temperature recorded across all weather stations.

Relationship between weather station latitude and average annual temperatures recorded.

The coefficient of determination (R2) is 0.77, meaning 77% of the variation in the dependent variable can be attributed to the independent variable.